Capturing diagnostic information
When you have issues with your Unraid server, gathering detailed information is crucial for effective troubleshooting. This information helps others provide accurate and timely assistance, especially when you post in forums.
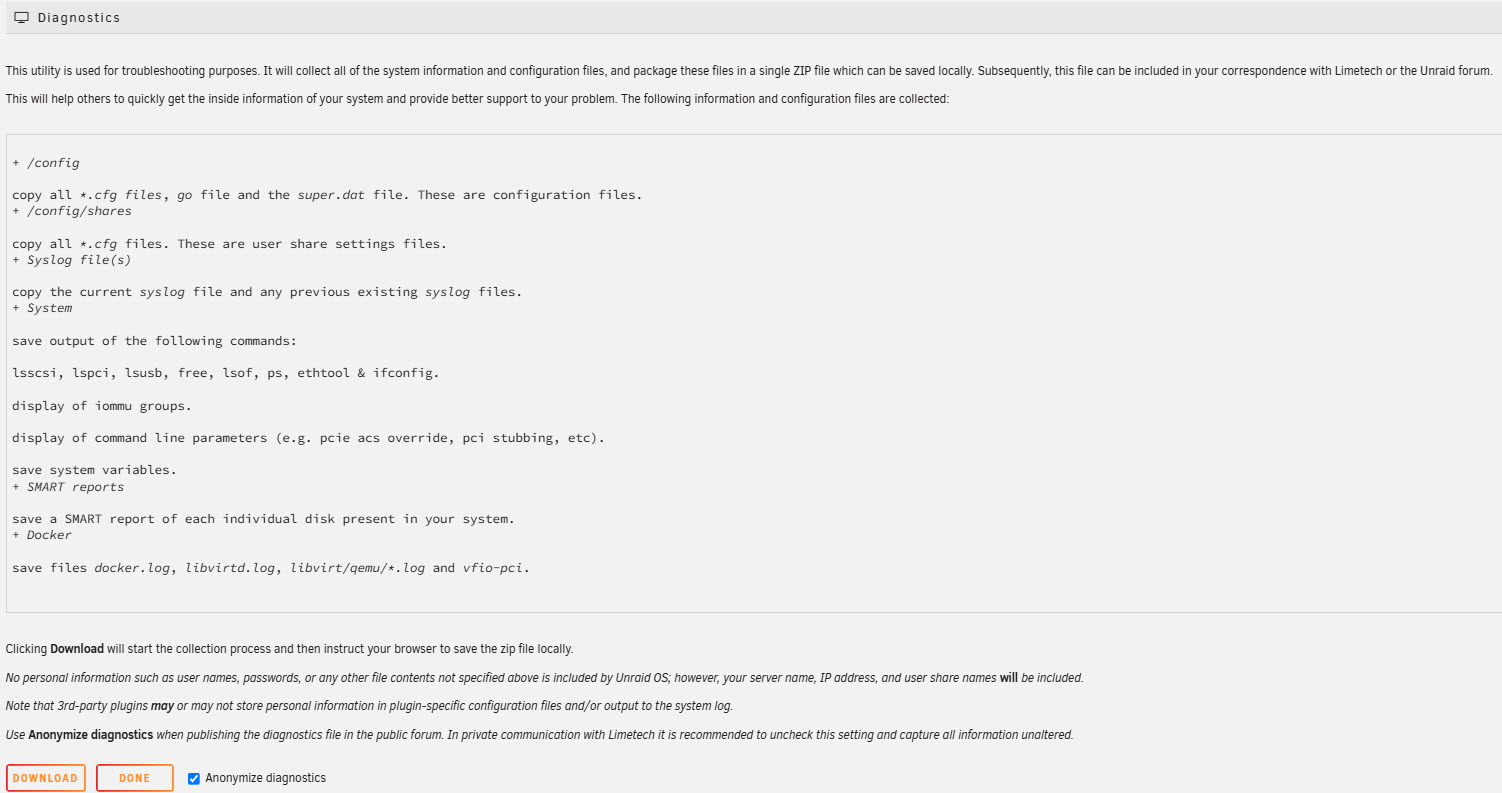
The diagnostics zip file contains several anonymized text files that create a detailed snapshot of your Unraid system, including:
- System configuration: Information about your array, shares, network settings, and installed plugins.
- System logs: Logs from the kernel, WebGUI, and system services, documenting events that may have led to the issue.
- Hardware information: Details about connected drives, controllers, and other hardware components.
- Docker and VM info: Overall configuration for Docker and virtual machines (no information about your individual containers or VMs is included).
System diagnostics
Unraid provides a Diagnostics tool located under Tools → Diagnostics in the WebGUI to capture comprehensive system information for troubleshooting. This tool will generate a zip file you can download and attach to forum posts for support. All diagnostics files are text-based, and users can review them to understand what information is included.
| Scenario | How to capture | Notes |
|---|---|---|
| WebGUI available | Use Tools → Diagnostics in the WebGUI to generate and download the diagnostics zip file. | Diagnostics are anonymized by default to protect sensitive data. |
| WebGUI not available | Access via SSH, telnet, or direct console to run the diagnostics command. The zip file saves to /boot/logs. | Always capture diagnostics before rebooting to keep logs intact. |
| Array started in normal mode | This is the preferred method for capturing diagnostics, as it provides the most complete information, especially about drive status. | If this isn't possible, see the Persistent logs section for alternative capture methods. |
Attach the single diagnostics zip file when posting on forums - avoid uploading the extracted files individually.
Anonymization of diagnostic data
By default, diagnostics are automatically anonymized. If you enable Mover logging under Settings → Scheduler → Mover Settings, the syslog will include details about files the Mover processes. It's best to allow Mover logging only when troubleshooting specific Mover-related issues, as it may reveal file paths and names.
When your system shuts down gracefully, the session log is saved automatically to the boot device. You can access it after rebooting by going to Tools → Syslog → syslog-previous. This log is also included in diagnostics on the next boot. However, if the system crashes, the system log will be lost. In these cases, enabling syslog mirroring to the boot device or using a remote syslog server is recommended to preserve logs for troubleshooting.
Testing drive read performance
You can use built-in Linux tools to evaluate the read performance of your hard drives. This is helpful when diagnosing slow parity syncs, sluggish disk responses, or mismatched speeds among drives in an array or cache.
Consider running disk read benchmarks if you experience:
- Extremely slow parity builds or parity checks
- Suspiciously slow file transfers from a specific disk
- Drive mismatches after adding or replacing disks, particularly when mixing SSDs and HDDs
- Reallocated sectors or UDMA CRC errors, which may indicate failing drives
While these tests won’t give you exact real-world file transfer speeds, they can point out underperforming disks and any controller bottlenecks.
Quick test (hdparm)
The hdparm tool measures both cached and buffered read speeds of a disk.
To run the test, replace X with your disk device (like sdb or sdg) and enter the following command:
hdparm -tT /dev/sdX
- The
-Tresult shows the cache read speed. - The
-tresult shows the buffered (sequential) disk read performance.
Run this test multiple times to get a more reliable benchmark. For example, you can use the following one-liner to run the test 12 times:
for ((i=0;i<12;i++)); do hdparm -tT /dev/sdX; done
Make sure to replace /dev/sdX with a valid physical device. Avoid logical Unraid devices, such as /dev/md1, which include parity processes that may distort the raw performance readings.
Comprehensive test (diskspeed.sh)
For a more detailed assessment of all attached drives, including parity and data drives, consider using the community script diskspeed.sh.
This script:
- Tests read speeds at multiple linear offsets across the disk surface
- Generates CSV data and performance heat maps (images)
- Can identify zones of poor performance, which might be a sign of failing hardware or problematic SMR drives
To get started with diskspeed.sh:
- Download the script from the Unraid forums.
- Place it in a persistent path like
/boot/scripts/. - Make it executable:
chmod +x /boot/scripts/diskspeed.sh
- Run the script:
bash /boot/scripts/diskspeed.sh
This script only performs read-only operations and won't modify any data on your drives. However, it's best to schedule the test during idle periods, as it may affect disk I/O and interfere with array performance.
Persistent logs (syslog server)
Persistent logs are essential for keeping a record of system events between reboots. Unlike standard logs that reset when the system restarts, persistent logs use Unraid's built-in syslog server to ensure you can diagnose crashes or intermittent issues that arise over time.
Choosing the right logging method
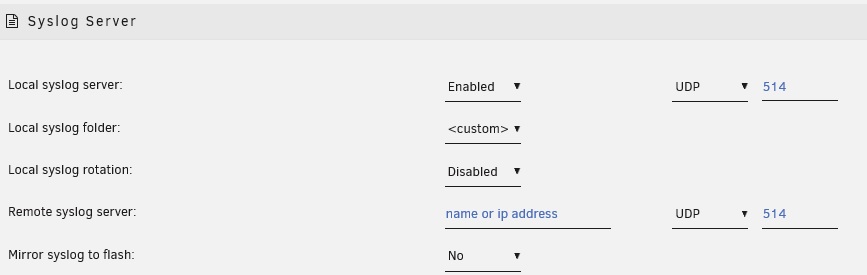
Go to Settings → Syslog Server to set up persistent logging. Each method has advantages and disadvantages:
| Method | Pros | Cons | Best for |
|---|---|---|---|
| Mirror syslog to boot drive | Captures boot process events | Can wear out the boot device quickly | Short-term diagnostics (a few days) |
| Remote syslog | Logs are stored on another device | Needs a separate always-on server | Long-term monitoring (weeks to months) |
| Local syslog | Keeps logs on the array or cache, reducing wear on the boot device | Less accessible if there's a system crash | Continuous logging without external devices |
For detailed configuration help, check the Help icon in the WebGUI toolbar.
Enabling the syslog server
- Mirror syslog to boot drive
- Remote syslog server
- Local syslog server
- Select Yes under Mirror syslog to boot drive.
- Click Apply. Logs will be saved to
/boot/logs/syslogon your boot device
On the next reboot, this file will be renamed to /boot/logs/syslog-previous. You can view this file through Tools → Syslog → syslog-previous, and it will also be included (anonymized) in diagnostics.
How it works
- By default, Unraid copies the syslog to the boot device during every graceful shutdown. This is managed through the "Copy syslog to boot drive on shutdown" setting, which is enabled by default.
- If you're troubleshooting crashes, you can enable "Mirror syslog to boot drive." This will write the syslog to both
/var/log/syslogand/boot/logs/syslogin real time. If a crash happens, any syslog entries recorded to the boot device before the crash will be preserved.
Both methods result in the creation of a /boot/logs/syslog-previous file after the next boot, which you can access via the syslog viewer and will be included in diagnostics.
The Copy syslog to boot drive on shutdown setting is safe for your boot device. However, enabling Mirror syslog to boot drive can lead to excessive writes if left on for an extended period. For long-term logging needs, consider using a local or remote syslog server instead.
- Set Local syslog server to Enabled.
- Enter the IP address of your syslog server under Remote syslog server.
- Click Apply.
- Logs will stream to the device you specified.
If you upload files from a remote syslog server to the forum, they will not be anonymized.
To create a persistent, reliable copy of your Unraid syslog on your server:
- Set Local syslog server to Enabled.
- Configure the following options:
- Local syslog folder: Use a cache-only or preferred share (best for SSDs).
- Rotation settings: Adjust the file size and number limits.
- For best results and to ensure all syslog data (including boot events) is captured, set the Remote syslog server field to your server's own IP address (the "Loopback method"), or the syslog will not be saved to the set share.
- This ensures syslog events are both stored locally and persist across reboots, without writing to the boot device.
- Click Apply.
- Logs will be saved to the share you specified.
- If you upload files from the local syslog server to the forum, they will not be anonymized.
- Logs saved using this method are not included in standard diagnostics. Attach them separately if you need support.
Accessing Docker container logs
While standard diagnostics only provide limited data for Docker and VM, you can access container logs directly for more detailed troubleshooting.
To retrieve Docker logs:
- Via WebGUI
- Via Command Line
- Persistent logging
- Navigate to Docker > Containers
- Click the Logs icon for the desired container
Use the command:
docker logs [container_name] > /path/to/save/log.txt
To map container logs to a host path, configure your container template like this:
/path/in/container:/logs
Virtual machine logs
VM logs can be accessed through their respective hypervisors (for example, QEMU logs are located in /var/log/libvirt/). Check your VM platform's documentation for more details.
Remember to attach the relevant container or VM logs separately when seeking support for application-specific issues.